National Basketball Association Statistics
~Michael Jordan
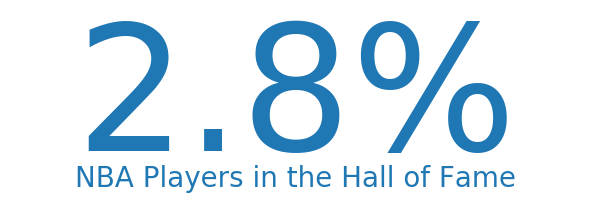
Out of all the outstanding players that have been in the NBA, less than three percent have been inducted into the Hall of Fame.
This project will apply machine learning techniques in search of the answers to these questions.
You're probably thinking, "What's the point?"
While singling out historical figures that deserve recognition for their accomplishments would contribute to the game, signing gifted athletes early in their careers to your team would lead to championships.
There are a couple of obvious paths to learning what traits will result in exceptional players at the professional level.
I possessed some talent in soccer during my youth, but was a complete liability on the basketball court. In lieu of dedicating the second half of my life to the art of round ball, let's choose option 2 and see what there is to find in almost 70 years of player statistics.
If you would like to investigate any of the datasets used for this project, check out the data files section below.
Links to all the source code and the project's Notebook are also available.
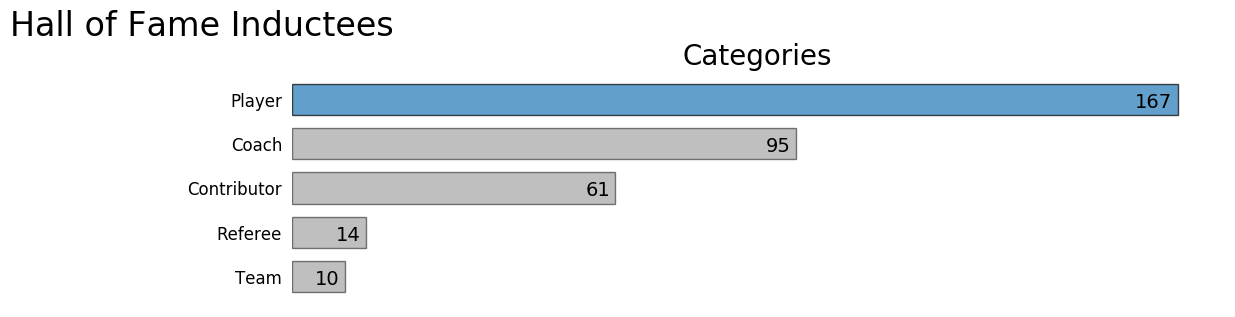
The Naismith Memorial Basketball Hall of Fame located in Springfield Massachusetts is where the best of the best are enshrined for history. There are a number of different ways to get into the Hall other than being a player, as shown in the graphic below.
Of interest is the fact that there are far fewer coaches at the pro level, but it appears they have a much higher percentage of being selected to join the Hall of Fame. So if your end goal is to be inducted into the Hall of Fame, coaching might be a better option than playing. One could also argue that getting a coaching appointment on a professional sports team is more difficult than getting in a game. The call on how to perceive that anomaly will be left up to you.
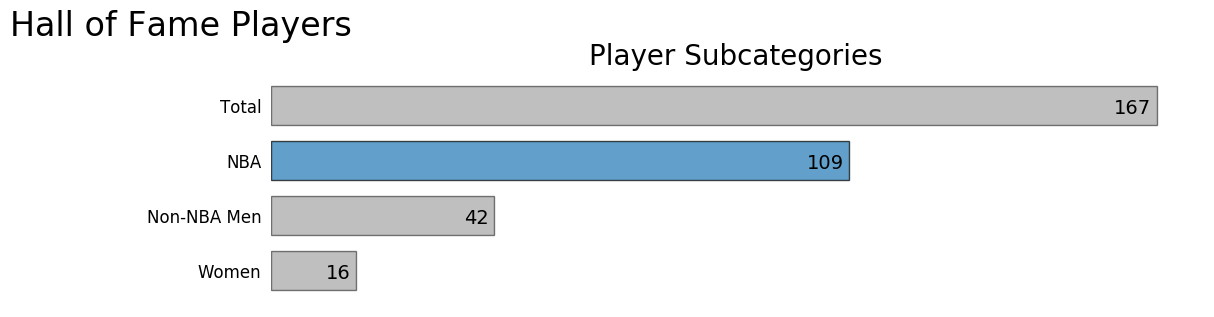
An important detail about the Naismith Memorial Basketball Hall of Fame is that it's for all Basketball. This means there are many player subcategories in the Hall.
The next chart depicts a break down of the different player categories as of 2012. For this project, we are concentrating on the inductees that played in the NBA. That means the calibration data sample size is reduced from 167 to 109.
It's also interesting to note that NBA Hall of Famers come from very few places on the planet. New York State has produced more Hall of Famers than any other location. Countries outside the United States with inductees include Jamaica, Lithuania, Canada, Croatia, France, and Nigeria.
The next graphic lists the birth place of all the Hall of Fame players ranked by quantity in descending order.
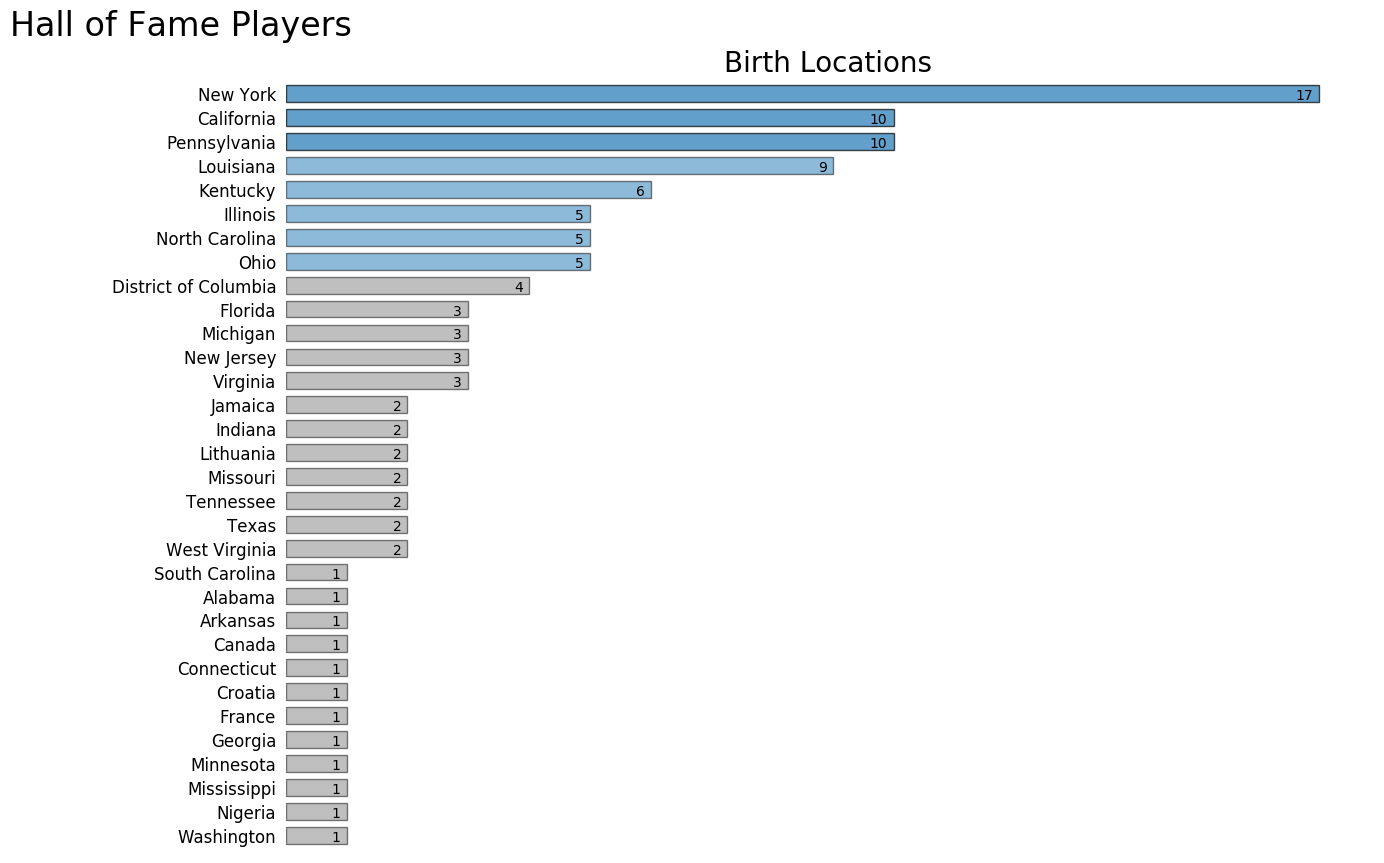
On the map, each circle glyph is proportional in size to the number of Hall of Fame players from that location.
Use the buttons on the right side of the map to pan and zoom.
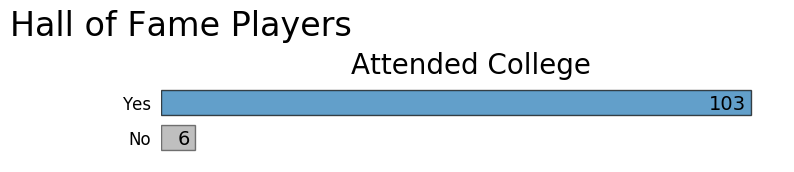
Another interesting fact about the players is the majority were members of collegiate teams. Until 1971 players had to exhaust four years of college eligibility to join the pros, but the entrance rules have changed multiple times over the years. As of 2006, any player declaring for the draft must be 19 years old and one year removed from high school.
Now that we have some background information, let's dive in and see what knowledge is hidden away in the player statistics.
The Season Statistics dataset contains 47 performance statistics for all NBA players going back to 1950. We are going to use these values to develop a predictive model to categorize if each season was Hall of Fame worthy or not. As the following correlation matrix displays, most of the linear relationships between the numerical variables are positive and some are significant.
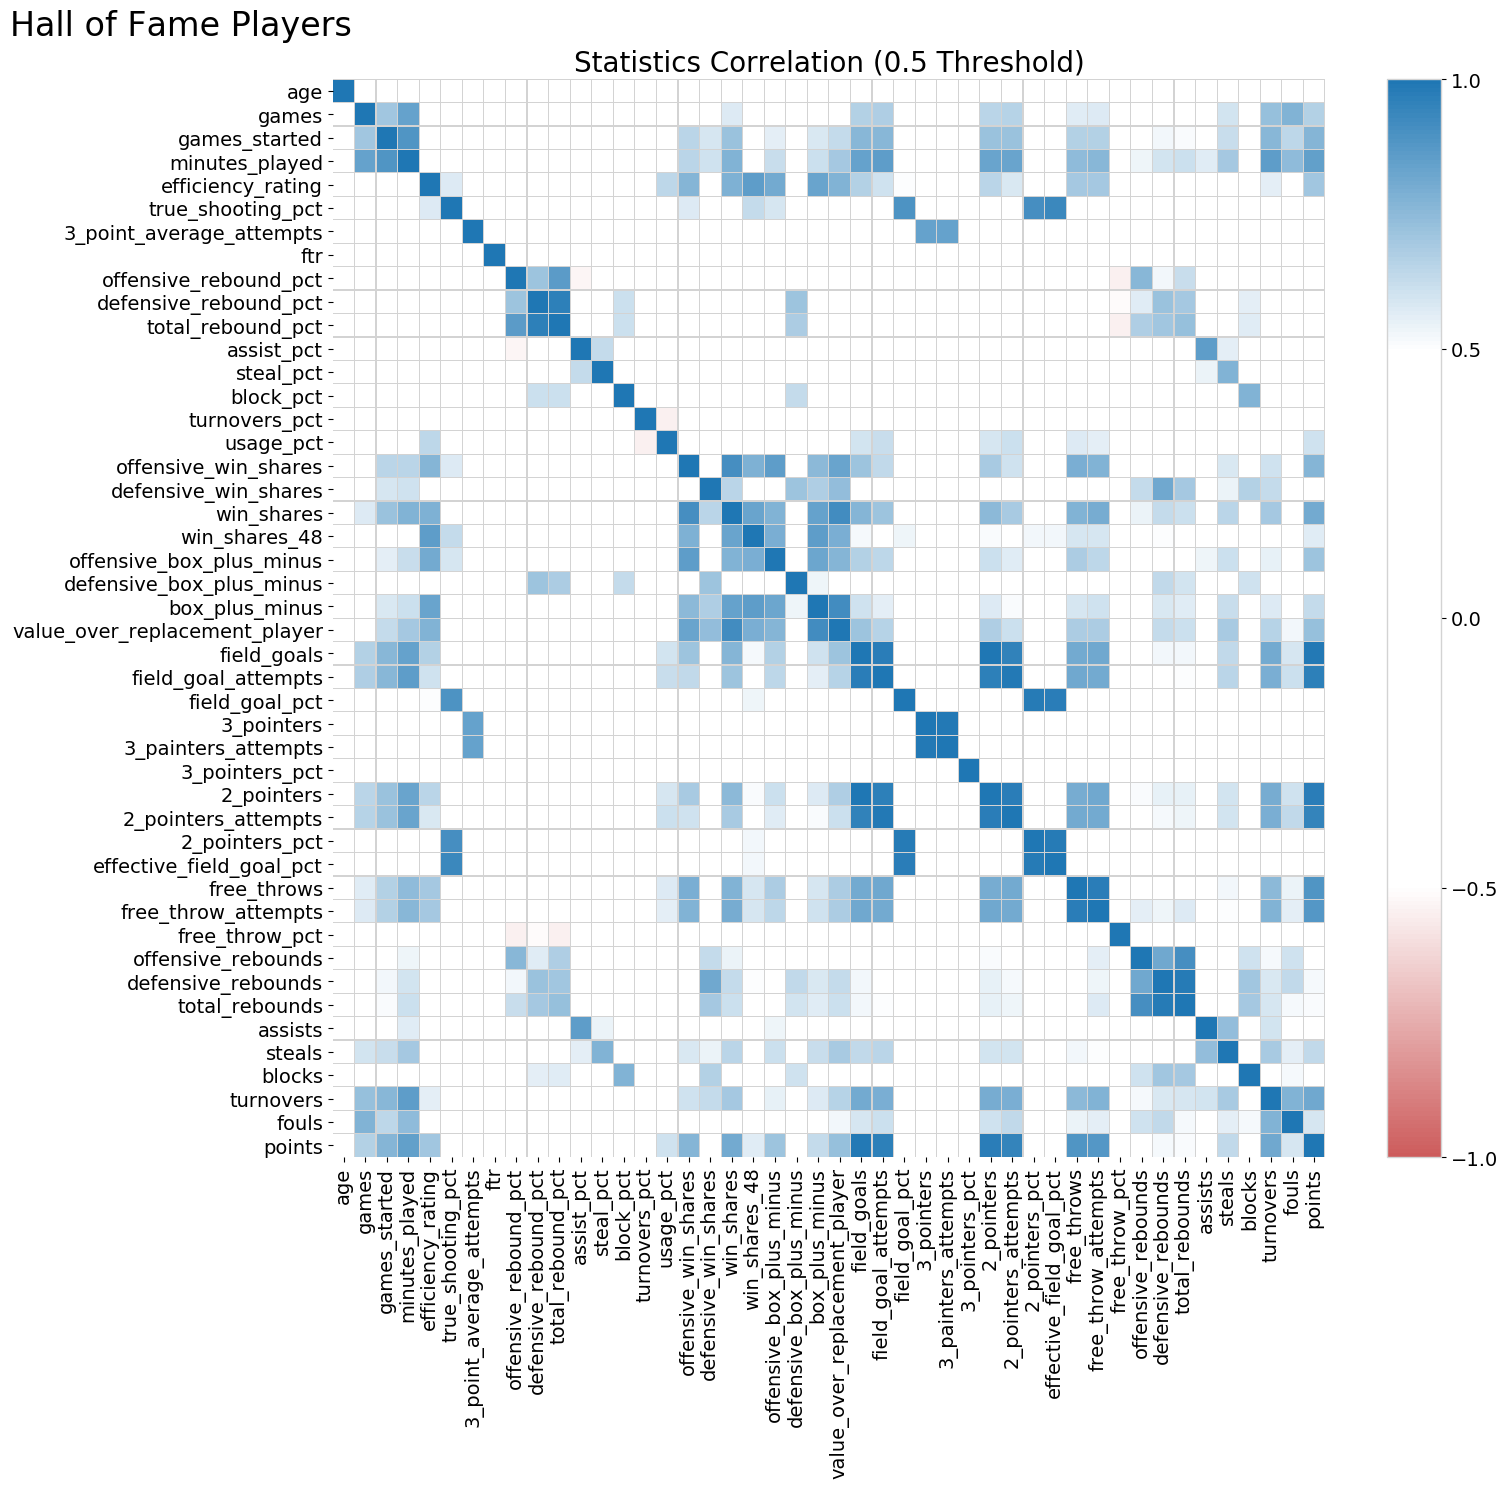
An added complexity of this dataset is values are logically missing from bulk portions of the records. For example, the three-point shot was introduced to the league in 1979. This results in every player's season prior to this date having a null value for this statistic.
A common approach to deal with these missing values would be to employ an imputer class to fill the holes with an aggregate function. Due to the mechanical nature of the null value locations, I chose not to utilize this technique. Instead, the data was partitioned into 21 unique subsets, each void of any null values. Why 21 you ask? This was the number of unique complete subsets that existed in the dataset. The following table breaks down which features are included in each subset.
| Features | 12 | 13 | 16 | 17 | 20 | 21 | 22 | 23 | 25 | 26 | 27 | 28 | 36 | 40 | 40 | 41 | 42 | 43 | 45 | 46 | 47 | 48 |
|---|---|---|---|---|---|---|---|---|---|---|---|---|---|---|---|---|---|---|---|---|---|---|
| Samples | 24624 | 24616 | 24577 | 24491 | 24478 | 24449 | 24137 | 23970 | 23970 | 23223 | 23970 | 23970 | 23223 | 21713 | 20746 | 19984 | 19984 | 18856 | 18856 | 18161 | 17486 | 14585 |
| 2-Point Field Goals | ✓ | ✓ | ✓ | ✓ | ✓ | ✓ | ✓ | ✓ | ✓ | ✓ | ✓ | ✓ | ✓ | ✓ | ✓ | ✓ | ✓ | ✓ | ✓ | ✓ | ✓ | ✓ |
| 2-Point Field Goal Attempts | ✓ | ✓ | ✓ | ✓ | ✓ | ✓ | ✓ | ✓ | ✓ | ✓ | ✓ | ✓ | ✓ | ✓ | ✓ | ✓ | ✓ | ✓ | ✓ | ✓ | ✓ | ✓ |
| 2-Point Field Goal Percentage | ✓ | ✓ | ✓ | ✓ | ✓ | ✓ | ✓ | ✓ | ✓ | ✓ | ✓ | ✓ | ✓ | ✓ | ✓ | ✓ | ✓ | |||||
| 3-Point Field Goals | ✓ | ✓ | ✓ | ✓ | ||||||||||||||||||
| 3-Point Field Goal Attempts | ✓ | ✓ | ✓ | ✓ | ||||||||||||||||||
| 3-Point Field Goal Average Attempts | ✓ | ✓ | ✓ | |||||||||||||||||||
| 3-Point Field Goal Percentage | ✓ | |||||||||||||||||||||
| Age | ✓ | ✓ | ✓ | ✓ | ✓ | ✓ | ✓ | ✓ | ✓ | ✓ | ✓ | ✓ | ✓ | ✓ | ✓ | ✓ | ✓ | ✓ | ✓ | ✓ | ✓ | |
| Assist Percentage | ✓ | ✓ | ✓ | ✓ | ✓ | ✓ | ✓ | ✓ | ✓ | ✓ | ✓ | ✓ | ||||||||||
| Assists | ✓ | ✓ | ✓ | ✓ | ✓ | ✓ | ✓ | ✓ | ✓ | ✓ | ✓ | ✓ | ✓ | ✓ | ✓ | ✓ | ✓ | ✓ | ✓ | ✓ | ✓ | ✓ |
| Block Percentage | ✓ | ✓ | ✓ | ✓ | ✓ | ✓ | ✓ | ✓ | ||||||||||||||
| Blocks | ✓ | ✓ | ✓ | ✓ | ✓ | ✓ | ✓ | ✓ | ✓ | |||||||||||||
| Box Plus Minus | ✓ | ✓ | ✓ | ✓ | ✓ | ✓ | ✓ | ✓ | ✓ | |||||||||||||
| Defensive Box Plus Minus | ✓ | ✓ | ✓ | ✓ | ✓ | ✓ | ✓ | ✓ | ✓ | |||||||||||||
| Defensive Rebound Percentage | ✓ | ✓ | ✓ | ✓ | ✓ | ✓ | ✓ | ✓ | ||||||||||||||
| Defensive Rebounds | ✓ | ✓ | ✓ | ✓ | ✓ | ✓ | ✓ | ✓ | ✓ | |||||||||||||
| Defensive Win Shares | ✓ | ✓ | ✓ | ✓ | ✓ | ✓ | ✓ | ✓ | ✓ | ✓ | ✓ | ✓ | ✓ | ✓ | ✓ | ✓ | ✓ | ✓ | ✓ | ✓ | ||
| Effective Field Goal Percentage | ✓ | ✓ | ✓ | ✓ | ✓ | ✓ | ✓ | ✓ | ✓ | ✓ | ✓ | ✓ | ✓ | ✓ | ✓ | ✓ | ✓ | ✓ | ||||
| Efficiency Rating | ✓ | ✓ | ✓ | ✓ | ✓ | ✓ | ✓ | ✓ | ✓ | ✓ | ✓ | ✓ | ✓ | ✓ | ||||||||
| Field Goal Attempts | ✓ | ✓ | ✓ | ✓ | ✓ | ✓ | ✓ | ✓ | ✓ | ✓ | ✓ | ✓ | ✓ | ✓ | ✓ | ✓ | ✓ | ✓ | ✓ | ✓ | ✓ | ✓ |
| Field Goal Percentage | ✓ | ✓ | ✓ | ✓ | ✓ | ✓ | ✓ | ✓ | ✓ | ✓ | ✓ | ✓ | ✓ | ✓ | ✓ | ✓ | ✓ | ✓ | ||||
| Field Goals | ✓ | ✓ | ✓ | ✓ | ✓ | ✓ | ✓ | ✓ | ✓ | ✓ | ✓ | ✓ | ✓ | ✓ | ✓ | ✓ | ✓ | ✓ | ✓ | ✓ | ✓ | ✓ |
| Fouls | ✓ | ✓ | ✓ | ✓ | ✓ | ✓ | ✓ | ✓ | ✓ | ✓ | ✓ | ✓ | ✓ | ✓ | ✓ | ✓ | ✓ | ✓ | ✓ | ✓ | ✓ | ✓ |
| Free Throw Attempts | ✓ | ✓ | ✓ | ✓ | ✓ | ✓ | ✓ | ✓ | ✓ | ✓ | ✓ | ✓ | ✓ | ✓ | ✓ | ✓ | ✓ | ✓ | ✓ | ✓ | ✓ | ✓ |
| Free Throw Percentage | ✓ | ✓ | ✓ | ✓ | ✓ | ✓ | ✓ | ✓ | ✓ | ✓ | ✓ | ✓ | ||||||||||
| Free Throws | ✓ | ✓ | ✓ | ✓ | ✓ | ✓ | ✓ | ✓ | ✓ | ✓ | ✓ | ✓ | ✓ | ✓ | ✓ | ✓ | ✓ | ✓ | ✓ | ✓ | ✓ | ✓ |
| Free Throw Rate | ✓ | ✓ | ✓ | ✓ | ✓ | ✓ | ✓ | ✓ | ✓ | ✓ | ✓ | ✓ | ✓ | ✓ | ✓ | ✓ | ✓ | ✓ | ||||
| Games | ✓ | ✓ | ✓ | ✓ | ✓ | ✓ | ✓ | ✓ | ✓ | ✓ | ✓ | ✓ | ✓ | ✓ | ✓ | ✓ | ✓ | ✓ | ✓ | ✓ | ✓ | ✓ |
| Games Started | ✓ | ✓ | ||||||||||||||||||||
| Minutes Played | ✓ | ✓ | ✓ | ✓ | ✓ | ✓ | ✓ | ✓ | ✓ | ✓ | ✓ | ✓ | ✓ | ✓ | ✓ | |||||||
| Offensive Box Plus Minus | ✓ | ✓ | ✓ | ✓ | ✓ | ✓ | ✓ | ✓ | ✓ | |||||||||||||
| Offensive Rebound Percentage | ✓ | ✓ | ✓ | ✓ | ✓ | ✓ | ✓ | ✓ | ||||||||||||||
| Offensive Rebounds | ✓ | ✓ | ✓ | ✓ | ✓ | ✓ | ✓ | ✓ | ✓ | |||||||||||||
| Offensive Win Shares | ✓ | ✓ | ✓ | ✓ | ✓ | ✓ | ✓ | ✓ | ✓ | ✓ | ✓ | ✓ | ✓ | ✓ | ✓ | ✓ | ✓ | ✓ | ✓ | ✓ | ||
| Points | ✓ | ✓ | ✓ | ✓ | ✓ | ✓ | ✓ | ✓ | ✓ | ✓ | ✓ | ✓ | ✓ | ✓ | ✓ | ✓ | ✓ | ✓ | ✓ | ✓ | ✓ | ✓ |
| Position | ✓ | ✓ | ✓ | ✓ | ✓ | ✓ | ✓ | ✓ | ✓ | ✓ | ✓ | ✓ | ✓ | ✓ | ✓ | ✓ | ✓ | ✓ | ✓ | ✓ | ✓ | ✓ |
| Steal Percentage | ✓ | ✓ | ✓ | ✓ | ✓ | ✓ | ✓ | ✓ | ||||||||||||||
| Steals | ✓ | ✓ | ✓ | ✓ | ✓ | ✓ | ✓ | ✓ | ✓ | |||||||||||||
| Team | ✓ | ✓ | ✓ | ✓ | ✓ | ✓ | ✓ | ✓ | ✓ | ✓ | ✓ | ✓ | ✓ | ✓ | ✓ | ✓ | ✓ | ✓ | ✓ | ✓ | ✓ | ✓ |
| Total Rebounds Percentage | ✓ | ✓ | ✓ | ✓ | ✓ | ✓ | ✓ | ✓ | ✓ | ✓ | ||||||||||||
| Total Rebounds | ✓ | ✓ | ✓ | ✓ | ✓ | ✓ | ✓ | ✓ | ✓ | ✓ | ✓ | ✓ | ✓ | ✓ | ✓ | ✓ | ||||||
| True Shooting Percentage | ✓ | ✓ | ✓ | ✓ | ✓ | ✓ | ✓ | ✓ | ✓ | ✓ | ✓ | ✓ | ✓ | ✓ | ✓ | ✓ | ✓ | ✓ | ✓ | |||
| Turnovers | ✓ | ✓ | ✓ | ✓ | ✓ | ✓ | ✓ | |||||||||||||||
| Turnover Percentage | ✓ | ✓ | ✓ | ✓ | ✓ | |||||||||||||||||
| Usage Percentage | ✓ | ✓ | ✓ | ✓ | ✓ | ✓ | ||||||||||||||||
| Value Over Replacement Player | ✓ | ✓ | ✓ | ✓ | ✓ | ✓ | ✓ | ✓ | ✓ | |||||||||||||
| Win Shares | ✓ | ✓ | ✓ | ✓ | ✓ | ✓ | ✓ | ✓ | ✓ | ✓ | ✓ | ✓ | ✓ | ✓ | ✓ | ✓ | ✓ | ✓ | ✓ | ✓ | ||
| Win Shares 48 | ✓ | ✓ | ✓ | ✓ | ✓ | ✓ | ✓ | ✓ | ✓ | ✓ | ✓ | ✓ | ✓ | ✓ |
Each subset will be sent through a pipeline to generate classification models. The key components to this automation will be covered in more detail, but here is the overall process.
This website was scraped to retrieve all the player Hall of Fame inductees through 2012. For the response, a value of one was assigned to the Hall of Famers, and a value of zero was given to all the other players.
The number of Hall of Fame records for each subset was grossly less than the regular player records, initially resulting in poor classification models. To remedy this issue, balanced training and test sets were generated using the following bootstrap technique.
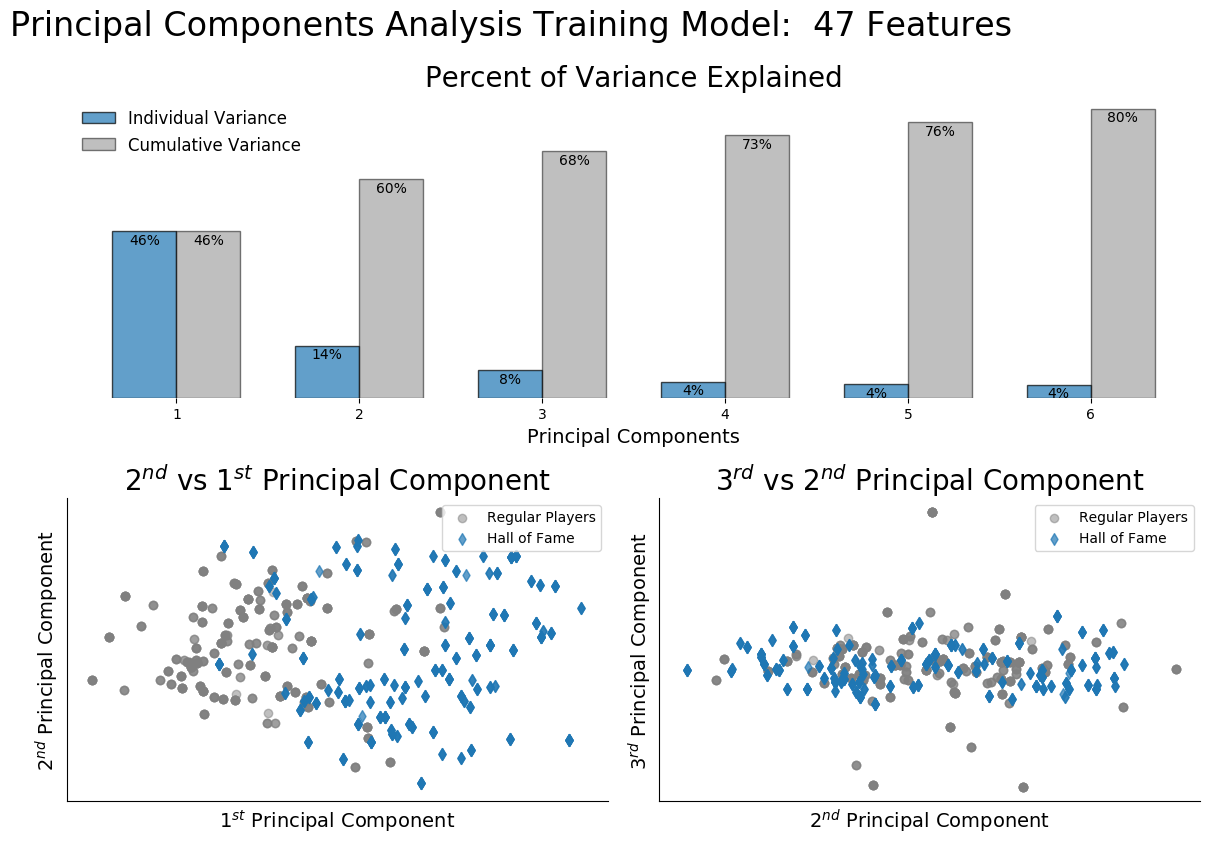
A Principal Components Analysis was performed on the test set for each subset to identify the components with maximum variance. This transformed space is normally used to reduce the number of features under consideration when generating a model, but due to the test set size of 1000 records, the computational time to keep all features was acceptable.
A summary plot for one of the subsets is shown below identifying the variance contribution of the most influential components and the first two hyperplanes of the PCA analysis. The influential components were chosen by including components where the first segment of the 2nd derivative of the individual variance curve was positive.
With the subset transformed into the PCA space, it was now time to feed the data into the following classification algorithms.
The next figure summarizes the predictive score for each model. If either the training or test score was below an accuracy of 80%, the subset was filtered out.
It's easily observed that the Logistic Regression model is the preferred choice for this dataset.
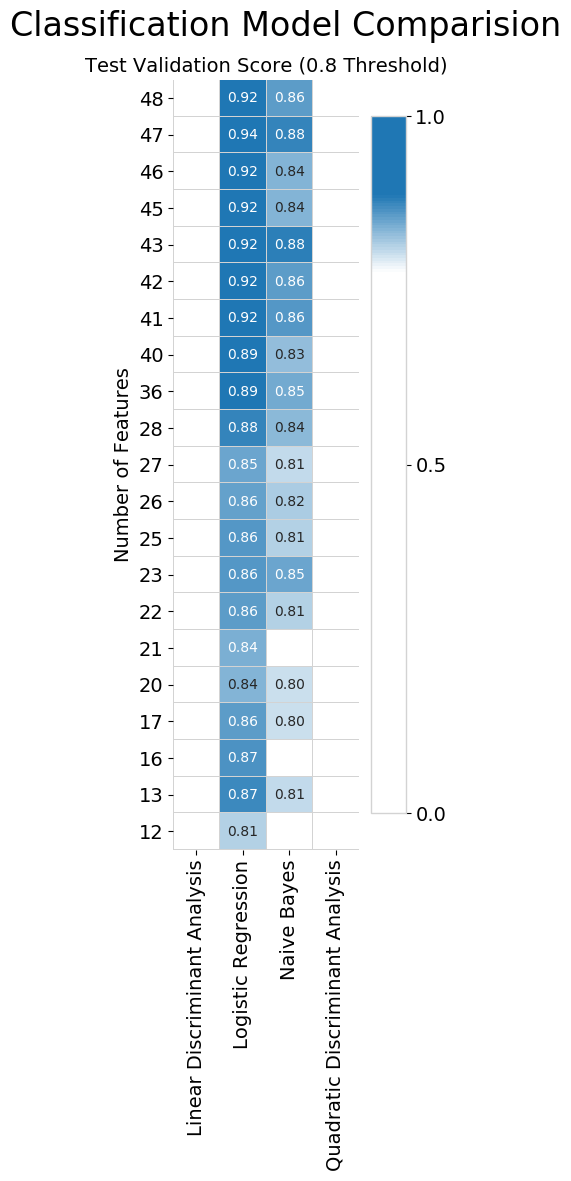
The subset utilizing 47 of the statistical features produced the highest predictive capability, but there is an element of stochastic variability involved in choosing the training and test sets. The machinery that analyzes this dataset has a default random seed value of zero chosen, which makes the results repeatable.
To verify the random seed value was not skewing the results, 100 instances of the Logistic Regression were run with the seed value allowed to be chosen at random. For each analysis, the subset with the highest accuracy was logged.
Here are the results of a particular batch.
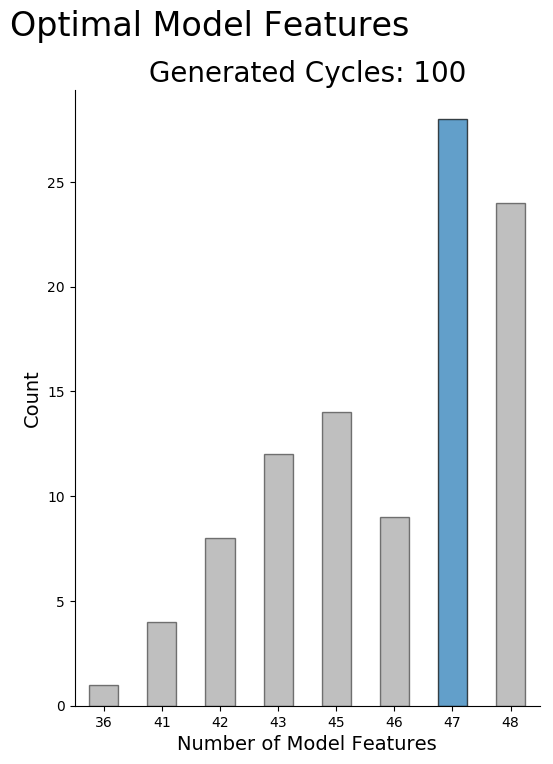
In some cases, the batch execution produced more high scores using the subset with 48 features than the subset of 47 features. The only difference between the two subsets was the feature 3-Point Field Goal Percentage. This information is captured in the combination of 3-Point Field Goals and 3-Point Field Goal Attempts, so I chose to use the subset of 47 features for future calculations.
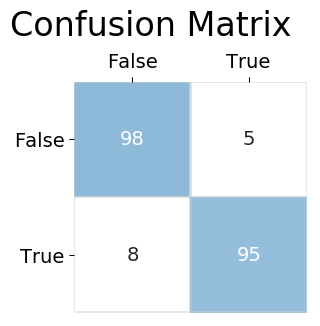
The confusion Matrix generated from the test set using the preferred model of Logistic Regression and a subset of 47 features is below.
Now let's see what can be learned by applying our model to the entire subset of 47 features.
Here is a list of the players classified as being Hall of Fame Worthy with the number predicted positive seasons in parentheses.
Since our original Hall of Fame list only included inductees up to 2012, let's check if any of our predicted players actually made it in. Again, the number of predicted positive seasons will be in parentheses.
From a total of 18 possible inductees, the model predicted only 2. This puts us 11% ahead of the default hypotheses that no one will be good enough to make the Hall of Fame.
To make an impact in the league, let's take a look at the players who have been pros for two years or less and have been identified as having Hall of Fame potential.
From a potential list of 1381 young players, the model has singled out 185 or 13% as potential greats. Identifying this subset would have a direct impact on the scouting and coaching staff with respect to piecing together a team designed for success.
Signing these players to medium term contracts would allow a team to be poised for multiple championship runs in the future.
This project looked at the NBA player statistics to generate a predictive model identifying potential Hall of Fame inductees. First, some characteristics of Hall of Fame players were presented. Then the details of creating a classification model were discussed. Finally, the derived model was employed to predict the next round of players to be inducted into the Hall of Fame in addition to singling out up and coming stars of the league.
Do you agree with the predictions? Who would you put in the basketball Hall of Fame? Leave a comment below and start the discussion!
The following data files were used in the project.
| Data File | Original Source |
|---|---|
Naismith Memorial Basketball Hall of Fame List |
NBA Website
All Basketball Hall of Fame Inductees
|
Player Dataset |
kaggle Website
NBA Player Details
|
Season Statistics |
kaggle Website
NBA Player Metrics by Season
|
Jupyter Notebook
Follow this link to view the project's notebook.
Python Modules
Follow this link to view the project's modules.
Note:
To create the geographic plots a
Google API Key
is required.
The key is easy to obtain, but make sure to not share your
key.
For more details check out Google's site.
This study was completed using the Anaconda distribution of Python 3.6.2.